-
2024 General Election Results
Students in New Jersey, ranging from grades 4 to 12, voted primarily via electronic ballots. Students submitted votes for President, Senate, and house candidates.
Students either submitted their ballots individually online or a representative from each participating school district collected the voting results and submitted them via an online form. 139 schools from all 12 congressional districts participated with a total of roughly 24,800 students casting votes.
The button below will take you to an interactive dashboard displaying the results. The color of the congressional district represents the candidate that received the most votes. Red represents the Republican candidate and blue represents the Democratic candidate. Hover your mouse over any congressional district for the maps or bars for the charts to see the percentage totals.
Open Results Dashboard! -
2023 Results
Students in New Jersey, ranging from grades 4 to 12, voted primarily via electronic ballots. Students submitted votes for candidates for the State Senate and the General Assembly.
Students either submitted their ballots individually online or a representative from each participating school district collected the voting results and submitted them via an online form. Schools from 27 legislative districts participated with a total of roughly 10,700 students casting votes.
The color of the legislative district represents the candidate that received the most votes. Red represents the Republican candidate and blue represents the Democratic candidate. General Assembly results are limited to the top four candidates in the districts in which more than four ran. Purple will be used to denote any district in which candidates of two different parties receive the most votes.
Download the Results Report (PDF)State Senate Map
Here are the final results. The yellow buttons can be clicked on to see total percentages for the candidates.
General Assembly Map
Here are the final results. The yellow buttons can be clicked on to see total percentages for the candidates.
The Current Issues
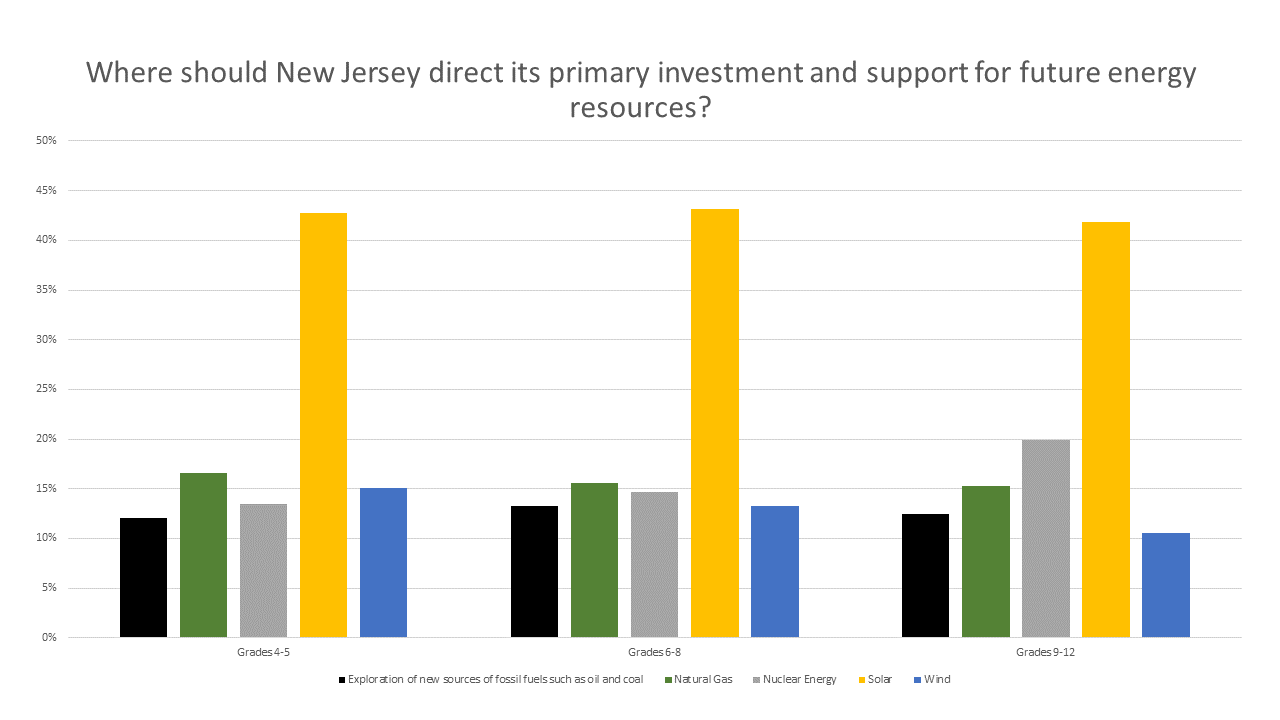
We asked the students where New Jersey should direct investment and support for future energy resources. The results are displayed by grade bands.
2022 Results
Students in New Jersey, ranging from grades 4 to 12, voted primarily via electronic ballots. Students submitted votes for candidates for the House of Representatives.
Students either submitted their ballots individually online or a representative from each participating school district collected the voting results and submitted them via an online form. Schools from all 12 congressional districts participated with a total of roughly 24,400 students casting votes.
The color of the district represents the candidate that received the most votes. Red represents the Republican candidate, blue represents the Democratic candidate, and green represents any third party candidate.
Download the Results Report (PDF)House of Representatives Map
Here are the final results. The yellow buttons can be clicked on to see total percentages for the candidates.
The Current Issues
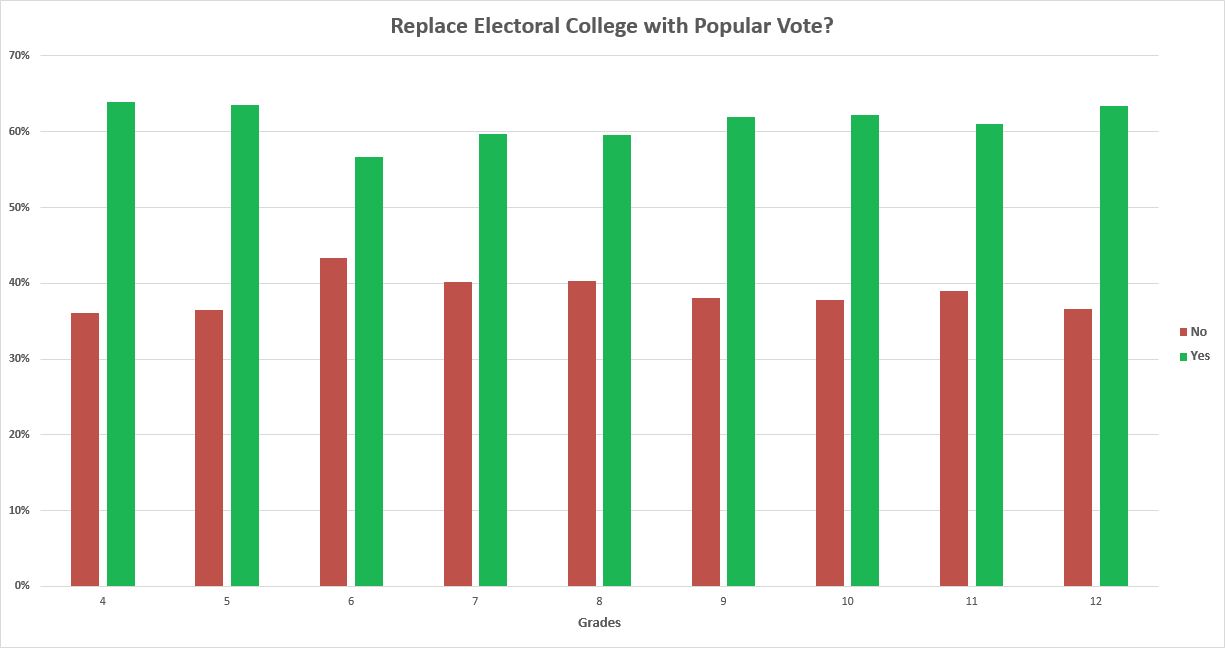
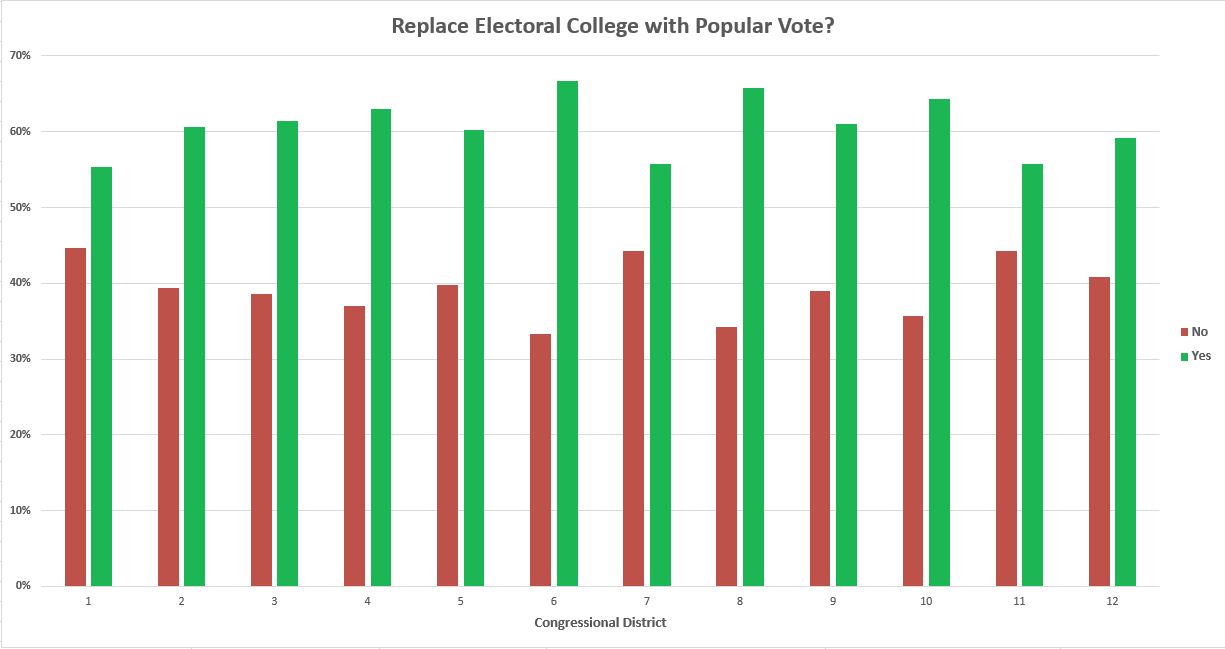
We asked the students whether the Electoral College should be replaced by a direct popular vote for president. The first chart below shows the results by grade. The second chart displays the results by congressional district.
2021 Results
Students in New Jersey, ranging from grades 4 to 12, voted primarily via electronic ballots. Students submitted votes for candidates for Governor, the State Senate, and the General Assembly.
Students either submitted their ballots individually online or a representative from each participating school district collected the voting results and submitted them via an online form. Schools from 26 legislative districts participated with a total of roughly 16,000 students casting votes.
In each map, the color of the legislative district represents the candidate that received the most votes. On the State Senate and General Assembly, red represents the Republican candidate and blue represents the Democratic candidate. General Assembly results are limited to the top four candidates in the districts in which more than four ran. Purple will be used to denote any district in which candidates of two different parties receive the most votes.
Download the Results Report (PDF)Governor Map
Here are the final Governor results. The yellow buttons can be clicked on to see total percentages for the candidates.
State Senate Map
Here are the final State Senate results. The yellow buttons can be clicked on to see total percentages for the candidates.
General Assembly Map
Here are the final General Assembly results. Blue district means the Democratic Party representatives received the most votes, and red means the Republican Party representatives received the most votes. Purple means the two top candidates are from different parties. The yellow buttons can be clicked on to see total percentages.
2020 General Election Results
Students in New Jersey, ranging from grades 4 to 12, voted primarily via electronic ballots. Students submitted votes for candidates for President, the Senate, and the House of Representatives.
Students either submitted their ballots individually online or a representative from each participating school district collected the voting results and submitted them via an online form. Schools within all the congressional districts participated, with a total of about 60,900 students casting votes.
In each map, the color of the congressional district represents the candidate that received the most votes. On House of Representative and Senate maps, red represents the Republican candidate and blue represents the Democratic candidate. No third party candidate received a majority of votes.
Download the Results Report (PDF)Presidential Map
Here is the final Presidential results. The yellow buttons can be clicked on to see total percentages for the candidates.
Senate Map
Here is the final Senate results. The yellow buttons can be clicked on to see total percentages for the candidates.
House of Representatives Map
Here is the final Senate results. Blue district means the Democrat representative received the most votes, and red means the Republican representative received the most votes. The yellow buttons can be clicked on to see total percentages.
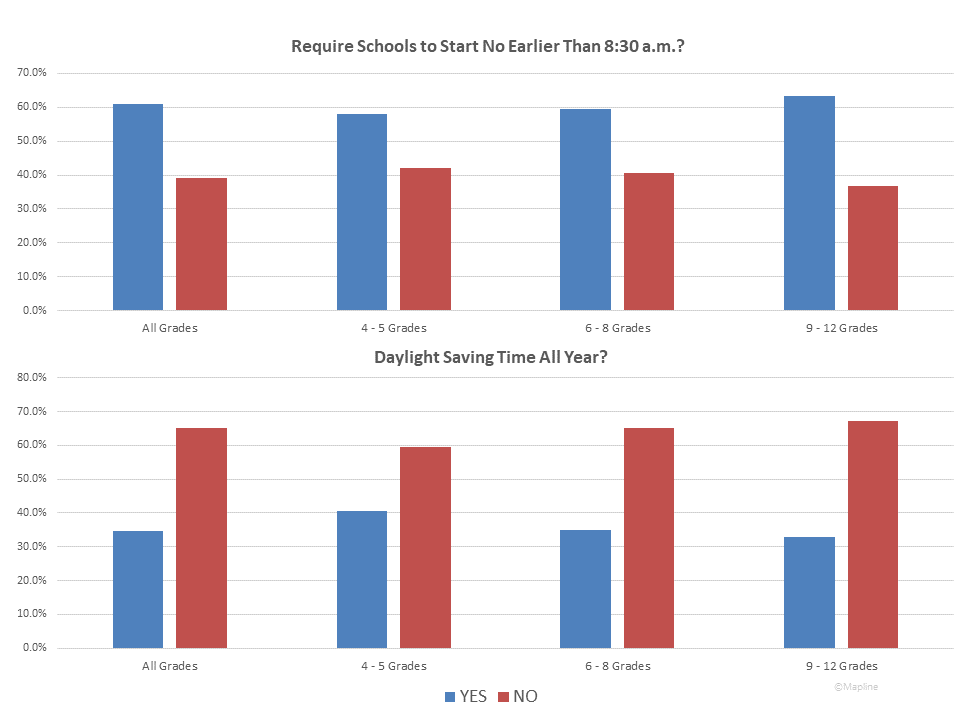
Students in New Jersey, ranging from grades 4 to 12, voted primarily via electronic ballots. Students submitted votes for the primary candidates based on their selected party as well as two issue questions: whether New Jersey should have Daylight Saving Time all year round and if New Jersey law should require that the school day start no earlier than 8:30am. 4-5th grade student votes were only for the issue questions.
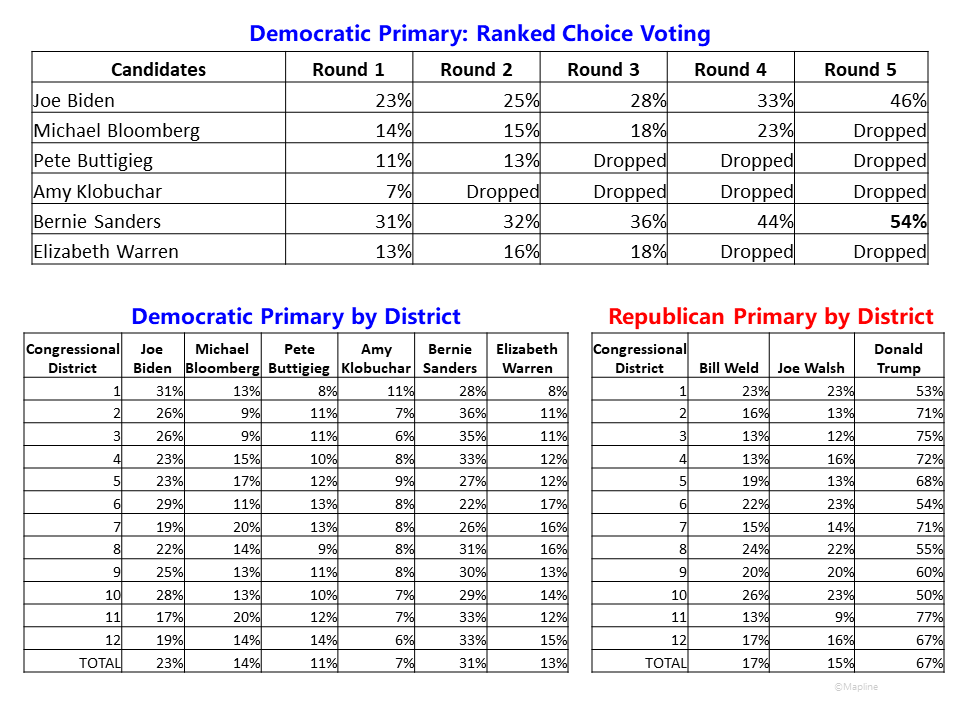
Students either submitted their ballots individually online or a representative from each participating school or school district collected the voting results and submitted them via an online form. In total, schools within all of the Congressional Districts participated, with a grand total of about 35,000 students casting votes. Students that voted online were able to participate in a “ranked choice” voting method. After selecting their party, students would rank the candidates of that party. In the charts, we show the voting distribution of each candidate by round. Every new round, a candidate is dropped and those ballots are reallocated until a candidate receives majority of the vote. More information on how ranked voting works can be viewed under Current Issues.
For the Republican party, Donald Trump achieved a majority in the first round, so there is no chart breaking down the results by round. And while delegates are not distributed according to Congressional Districts, there are also maps displaying the results of the first round of voting by Congressional District. Results of the two current issue questions are displayed in charts by grade sections.
More detailed results, including breakdown by grades is available in the PDF download.
Download the Results Report (PDF)These results are a limited sample of student views, representing only those schools and classes that chose to vote in the mock election.
Final Results
Below are three charts. The first is showing the Democratic results for each round of the ranked choice voting. Donald Trump had a majority in the first round, so results are only displayed for the Democratic party. The other two charts are showing the breakdown of votes received in the initial round of voting.
Democratic Primaries Map
Here is a visual for the initial round of voting. The yellow buttons can be clicked on to see total percentages for the candidates.
Republican Primaries Map
Here is a visual for the initial round of voting. The yellow buttons can be clicked on to see total percentages for the candidates.
The Current Issues
We asked the students two current issue questions: 1) Should New Jersey law require that the school day start no earlier than 8:30 a.m.? 2) Should we eliminate the time change in the fall, making it Daylight Saving Time all 12 months of the year? Below are charts showing results by grade section for each question.
2019 Results
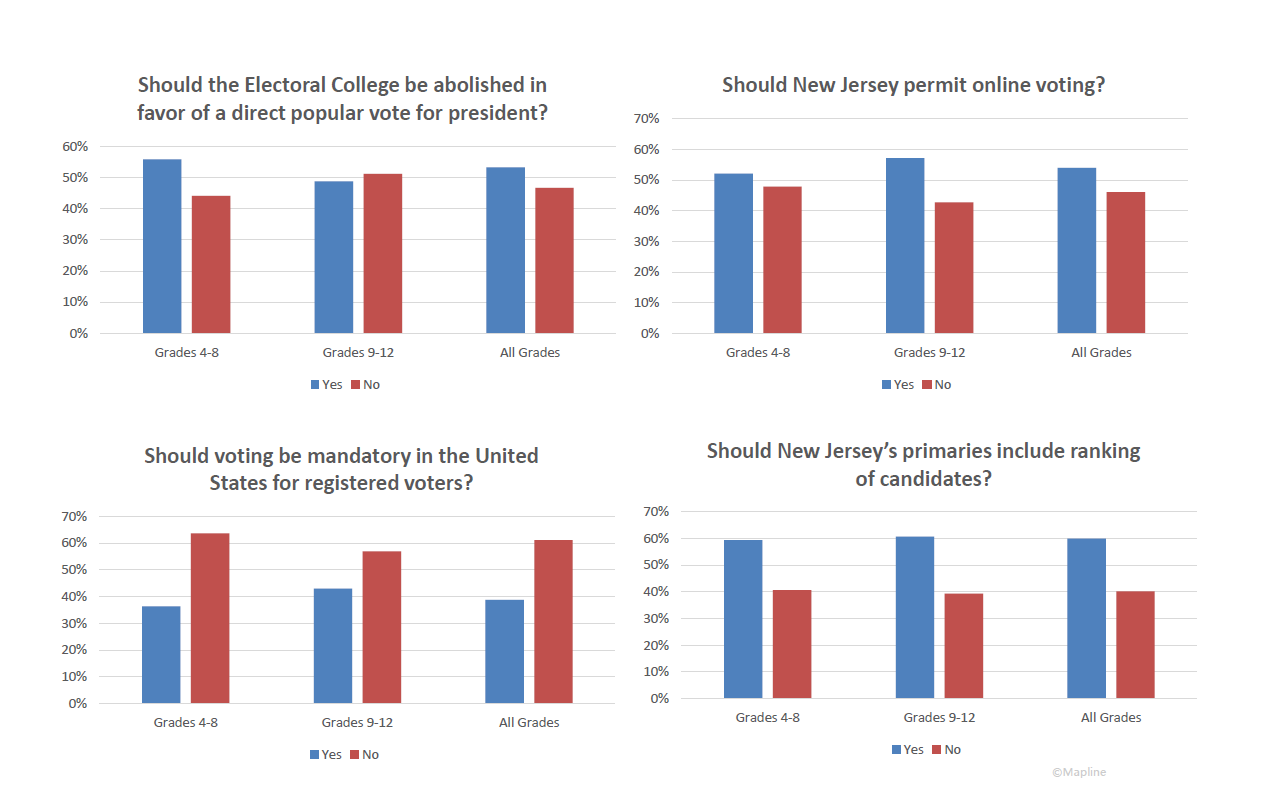
Students in New Jersey, ranging from grades 4-12 voted primarily via electronic ballots. Students submitted votes for General Assembly candidates as well as four questions: whether the Electoral College should be abolished in favor of a direct, popular vote, if online voting should be offered, if voting should be mandatory, and if New Jersey should implement a system of ranked voting.
Students either submitted their ballots individually online or a representative from each participating school district collected the voting results and submitted them via an online form. In total, schools within 26 Legislative Districts participated, with a total of about 12,500 students casting votes.
The color of the Legislative District represents the candidate that received the most votes. Red means both elected candidates were Republican and blue means both elected candidates were Democrat. Purple means the representatives elected by the students are not from the same party (e.g. one Democrat and one Republican). Third party candidates were on the ballot.
Download the Results Report (PDF)General Assembly Map
Here is the final General Assembly results. The yellow buttons can be clicked on to see total percentages for the top four candidates.
The Current Issues
We asked the students four current issue questions: 1) Should the Electoral College be abolished in favor of a direct, popular vote, 2) Should New Jersey permit online voting, 3) Should voting be mandatory in the UNited States for registered voters, 4) Should New Jersey’s primaries include ranking of candidates? Below are charts showing results by grade section for all four questions.
2018 Results
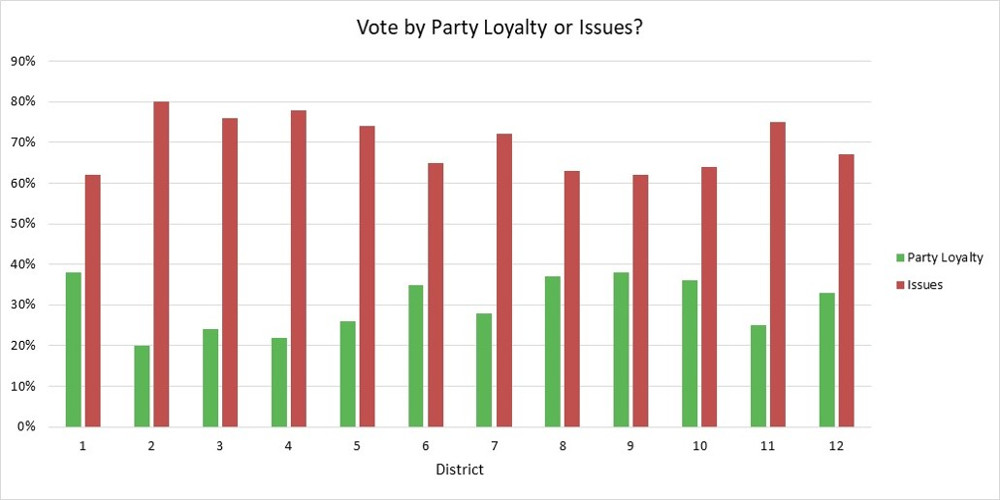
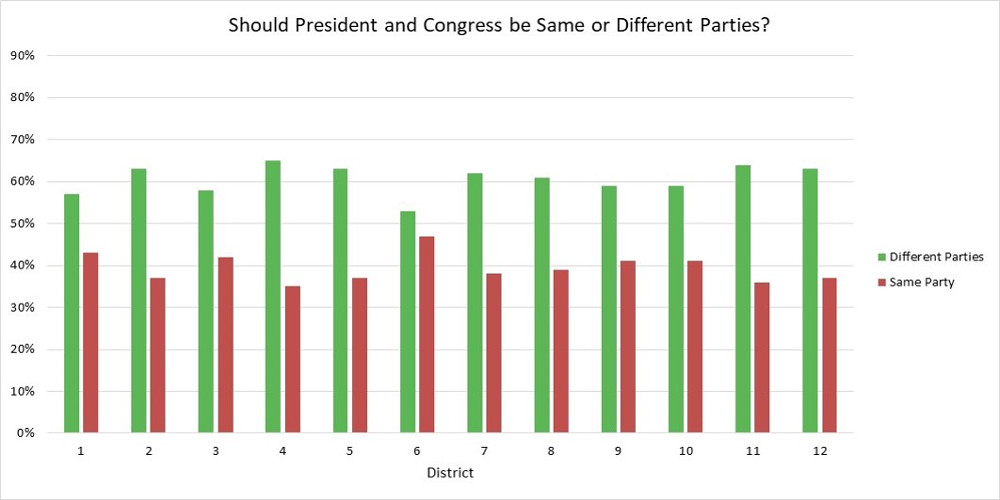
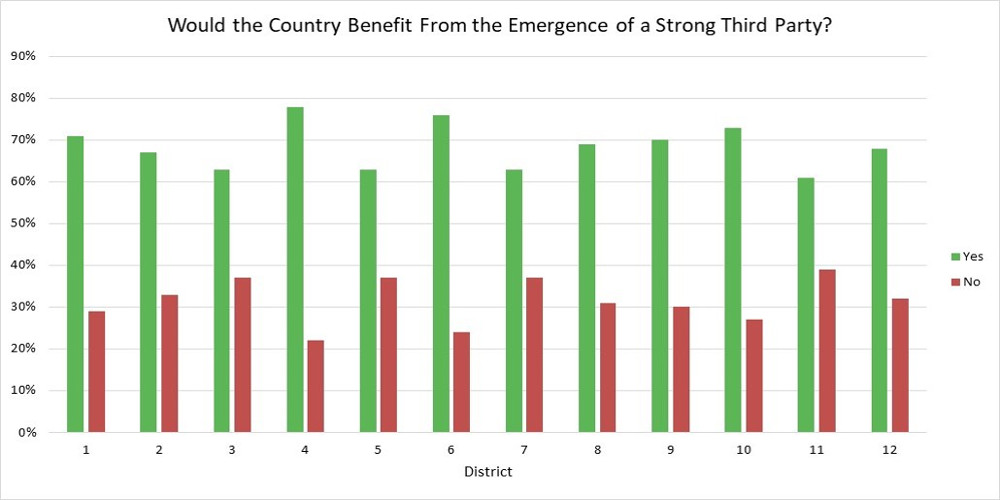
Students in New Jersey, ranging from grades 4-12 voted primarily via electronic ballots. Students submitted votes for five categories: House of Representatives, Senate, whether they vote by party loyalty or by the issues, should President and Congress be from the same or different parties, and whether or not the nation would benefit from the rise of a strong third party. Votes were received from students residing in each congressional district. These votes were tallied up to generate the result by Congressional District and by Grade.
Students either submitted their ballots individually online or a representative from each participating school district collected the voting results and submitted them via an online form. In total, all 12 Congressional Districts participated, with a total of about 24,500 students casting votes. 12,533 students were from grades 4-8, and 11,935 were from grades 9-12. Below is a table with the total students per grade.
In each map, the color of the congressional district represents the candidate or issue stance that received the most votes. On House of Representative and Senate maps, red represents the Republican candidate and blue represents the Democrat candidate. On issue maps, green and red are used instead of party colors.
Download the Results Report (PDF)Senate Map
Here is the final Senate results. Blue district means Menendez received the most votes, and red means Hugin received the most votes. The yellow buttons can be clicked on to see total percentages.
House of Representatives Map
Here is the final House results. Blue district means the Democrat representative received the most votes, and red means the Republican representative received the most votes. The yellow buttons can be clicked on to see total percentages.
The Current Issues
We asked the students three opinion questions: 1) Do you vote by party loyalty or by candidate and issues, 2) Is it better for Congress and the Presidency to be of the same party or different parties, 3) Would the country benifit from the rise of a third party? Below are charts showing results by Congressional District of all three questions.
2017 Results
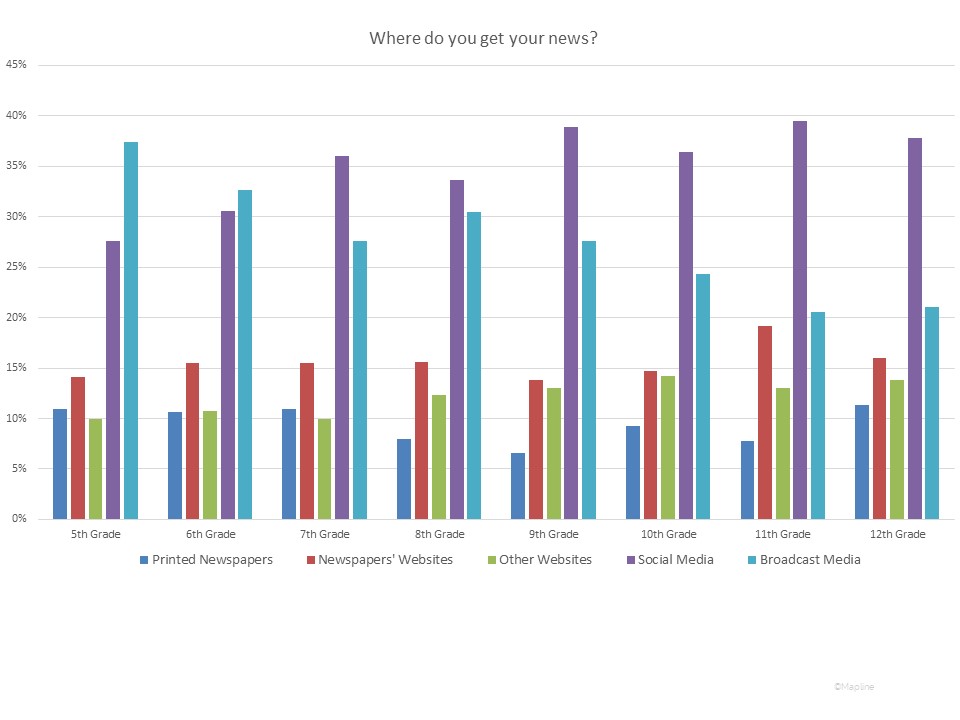
Students in New Jersey, ranging from grades 5-12 voted primarily via paper ballots. Students submitted votes for four categories: Governor, Senate, General Assembly, and where they got their news. 85% of the students submitted votes for all four categories. The remaining 15% only submitted votes for the gubernatorial candidates. Votes were received from students residing in 18 of the 40 Legislative Districts. The missing districts are not shown in the reporting tables.
A representative from each participating school district collected the voting results and submitted them via an online form. In total, 25 school districts across NJ participated, with a grand total of about 14,100 students casting votes. About 6,900 students were from grades 5-8, and 7,200 were from grades 9-12.
Download the Results Report (PDF)Total Maps by District
Gubernatorial Map
Here is the final Governor results. Blue district means Murphy/Oliver received the most votes, and red means Guadagno/Rendo received the most votes. The yellow buttons can be clicked on to see total percentages.
State Senate Map
Here is the final Senate results. Blue district means the Democrat representative received the most votes, and red means the Republican representative received the most votes. The yellow buttons can be clicked on to see total percentages.
General Assembly Map
Here is the final General Assembly results. Blue district means the two Democrat representatives received the most votes, red means the two Republican representatives received the most votes, and purple means a representative from each major party received the most votes. The yellow buttons can be clicked on to see total percentages.
News Source Map
Here is the news source results. Students were asked to select all the news sources they use from the following list: printed newspapers, newspapers via their websites, other websites, social media, and broadcast media. The chart below is broken down by grade, showing the percentage of students within each grade that used a particular news source.
2016 Results
Students in New Jersey ranging from grades 5-12 voted primarily via paper ballots. Students submitted votes for four categories: President, House of Representatives, whether or not NJ should enact a gas tax, and whether or not there should be term limits for Congressmen. 85% of the students submitted votes for all four categories. The remaining 15% only submitted votes for the presidential candidates. Votes were received from students residing in each congressional district. Additionally, votes were received from students residing in every county except for Atlantic, Salem, and Gloucester. These missing counties are not shown in the reporting tables.
A representative from each participating school district collected the voting results. In total, 74 school districts across NJ participated, with a grand total of about 65,700 students casting votes.
Download the Results Report (PDF)Total Maps by District
President Map
Here is the final President results by District. Blue district means Clinton received the most votes, and red means Trump received the most votes. The yellow buttons can be clicked on to see total percentages.
House of Representatives Map
Here is the final results by District. Blue district means the Democrat representative received the most votes, and red means the Republican representative received the most votes. The yellow buttons can be clicked on to see total percentages.
Gas Tax Map
Here is the final gas tax results by District. Red means the majority voted “no” and and red means the majority voted “yes.” The yellow buttons can be clicked on to see total percentages.
Term Limits Map
Here is the final term limits results by District. Red means the majority voted “no” and and red means the majority voted “yes.” The yellow buttons can be clicked on to see total percentages.
